Pcmon
Analog visualization for PC resources

Lately I was using some resource-intensive programs at work and couldn’t reserve screen space for the task manager, in order to keep tabs on the CPU and RAM use.
To solve this problem I decided to create an external device which could show those values I was interested in. But I also wanted to create something striking to have on my desk. I decided to use a pair of analog VU-meters to reach the desired goals.
PROGRAMMING
The system is composed of a server and a client application.
Server
The server app is a .NET console app I quickly whipped out on Visual Studio. I didn’t want to invest any time here.
The program reads the system resource values, adapts them to a 0-100 percent range and sends them to the client arduino app via serial communication.
Client (Arduino)
The client app is an Arduino program. It reads the values passed from the server via serial, does a little processing and shows them in the VU-meters.
As you’ll see in the Electronics section the VU-meters aren’t but a pair of modified voltage meters. In order to show any value on them the arduino just needs to generate a voltage in a given range. That’s accomplished via PWM output.
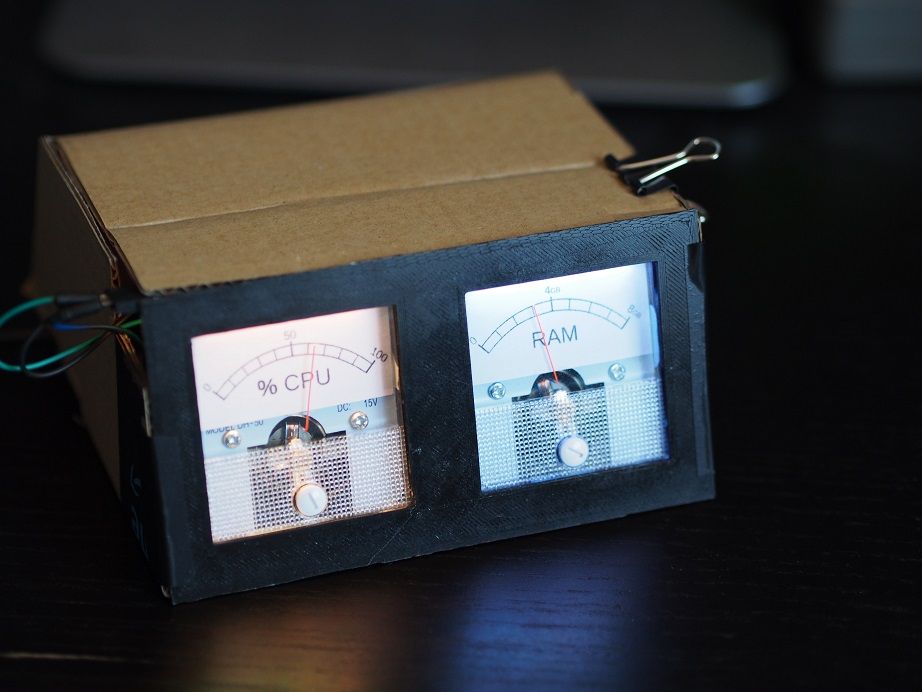
There are also a pair of RGB LED strips. These change colour based on the load of the system. Up to 60% load the Arduino just uses a blue-ish tint. But when the values climb above that threshold the colour becomes warmer, ranging from yellow to red.
To do this colour progression I decided to use the HSV colourspace and alter the hue proportionally to the value shown in the VU-meter. This was an incredible simple way to implement this functionality.
ELECTRONICS
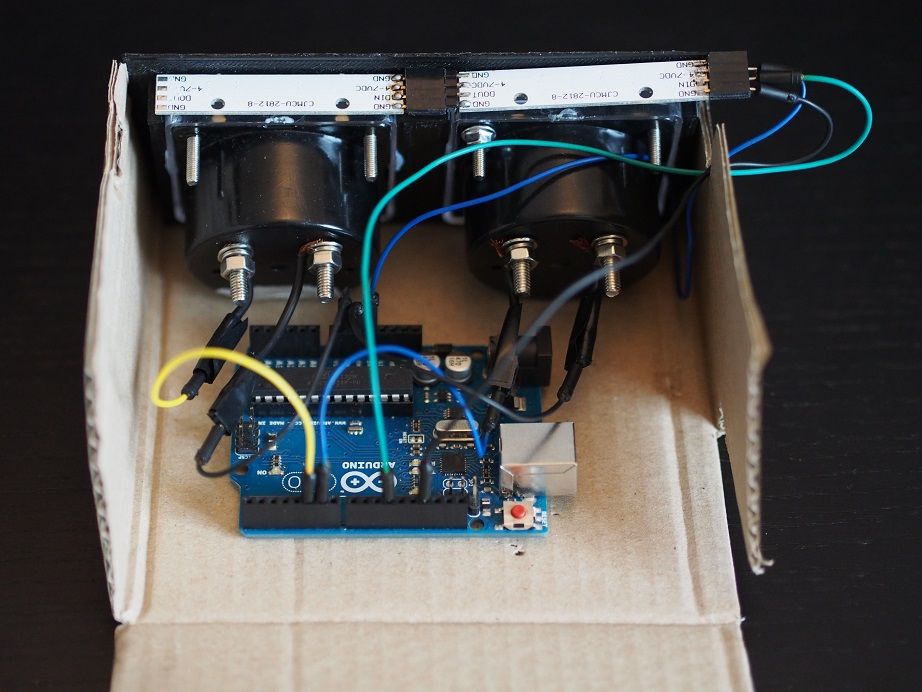
The base of this system is an Arduino UNO board. Only 3 of the PWM outputs are used to make everything work.
VU-meters
The VU-meters are a pair of voltage meters I bought on ebay. Their original range was 0-15V, I opened them up and changed the resistor they had inside to make them work on a 0-3.3V range, originally I was going to use a NodeMCU board as the brains.
I then scanned the voltmeter’s panel and designed with GIMP a new one for CPU values and another one for RAM values. I printed them and stuck them over the original panel.
To show a value on the VU-meter the arduino just has to generate a specific voltage on the 0-3.3V range via one of the PWM ports.
LED sticks
I used a pair of LED sticks to give a sort of backlight to the VU-meters.
Originally I didn’t want to create backlightning, just a way to warn me when the meters reached their max values. To achieve this I wanted to use a simple red LED, but I didn’t have anywhere to put it and didn’t have the tools to modify the VU-meters’ enclosure.
I then used the LED sticks to make the meters glow when their max values where reached, but wanted to create a cooler effect. All in all, RGB LEDs are capable of much more than just what I intended to use them for.
Due to some problems with Adaruit’s neopixel library I found and ended up using the fastled library to drive the LED sticks. This library also allowed me to use the HSV colourspace and solve the color-progression problem easily.
EXTERIOR
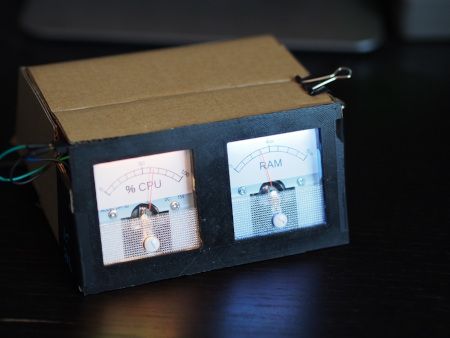
In order to make the device self-contained I started to design a simple enclosure with CAD software, but soon it become clear that it would be pretty big. In order to avoid printing large pieces I only printed the front panel, which on its backside has supports for the heavy VU-meters.
The rest of the enclosure was made with a cardboard box and taped together.
PUTTING IT TOGETHER